The Background of SMARTCyp
Drug metabolism is usually considered to occur in two phases, phase I and II.The cytochrome P450 enzyme family is the major contributor to phase I metabolism, accounting for 75% of the metabolism of marketed drugs. Thus, prediction of this metabolism is of large interest.The Work Behind SMARTCyp
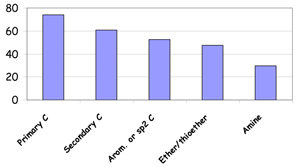 The work that has lead to the development of SMARTCyp started in 2006 with investigations showing that simple fragment rules could be devised for P450 oxidations at aliphatic carbon sites from DFT calculations of transition states using a porphyrin model [1]. For a set of relatively simple model compounds the fragment rules were shown to be as good as AM1 or B3LYP calculations using smaller model systems.
In 2009, the aliphatic oxidations were combinded with data from DFT calculations on aromatic sites [2] as well as new data. It was shown that a model for carbon atoms could be combined with docking into a crystal structure to get good accuracy for the prediction of metabolites from the CYP1A2 isoform [3].
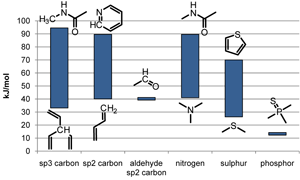 In 2010, the SMARTCyp method [4] was created. SMARTCyp uses all data from DFT calculations on aliphatic and aromatic hydroxylations as well as on hetero-atom oxidations [5] and lots of new data. Data from 211 transition state calculations have been used to create the fragment based energy rules in SMARTCyp 1.5.[6]
In 2011 and 2012, models for prediction of CYP2D6 and CYP2C9 specific metabolism were included in SMARTCyp.[7][8] This was released with version 2.0 and 2.1 of SMARTCyp.
Also in 2012, improvements for N-oxidations of tertiary amines were included, specifically an empirical corrections to unlikely oxidations of tertiary alkylamines. [9] This was released with version 2.3 of SMARTCyp.
Finally, in 2013, the solvent accessible surface area was included in the scoring function through the novel 2DSASA algorithm that estimates the atomic SASA from the 2D structure.[10]
References
- L. Olsen, P. Rydberg, T. H. Rod, U. Ryde. Prediction of Activation Energies for Hydrogen Abstraction by Cytochrome P450 J. Med. Chem., 2006, 49, 6489-6499
- P. Rydberg, U. Ryde, L. Olsen. Prediction of Activation Energies for Aromatic Oxidation by Cytochrome P450 J. Phys. Chem. A, 2008, 112, 13058-13065
- P. Rydberg, P. Vasanthanathan, C. Oostenbrink, L. Olsen. Fast Prediction of Cytochrome P450 Mediated Drug Metabolism ChemMedChem, 2009, 4, 2070-2079
- P. Rydberg, D. E. Gloriam, J. Zaretzki, C. Breneman, L. Olsen. SMARTCyp: A 2D Method for Prediction of Cytochrome P450-Mediated Drug Metabolism ACS Med. Chem Lett., 2010, 1, 96-100
- P. Rydberg, U. Ryde, L. Olsen. Sulfoxide, Sulfur, and Nitrogen Oxidation and Dealkylation by Cytochrome P450 J. Chem. Theory Comput., 2008, 4, 1369-1377
- P. Rydberg, D.E. Gloriam, L. Olsen. The SMARTCyp cytochrome P450 metabolism prediction server Bioinformatics, 2010, 26, 2988-2989
- P. Rydberg and L. Olsen. Ligand-based Site of Metabolism Prediction for Cytochrome P450 2D6 ACS Med. Chem Lett., 2012, 3, 69-73
- P. Rydberg and L. Olsen. Predicting Drug Metabolism by Cytochrome P450 2C9 - Comparison to the 2D6 and 3A4 Isoforms ChemMedChem, 2012, 7, 1202-1209
- P. Rydberg et al.,Nitrogen Inversion Barriers Affect the N-Oxidation of Tertiary Alkylamines by Cytochromes P450 Angew. Chem, Int. Ed. 2013, 52, 993-997
- P. Rydberg et al., The Contribution of Atom Accessibility to Site of Metabolism Models for Cytochromes P450 Mol. Pharmaceutics 2013, 10, 1216-1223